RG
Ravinder Gupta.
Open to Data Analyst Roles & Immediate Availability

Translating Complex Data into Executive Intelligence.

I'm a business-driven Data Analyst specializing in Star/Snowflake dimensional modeling, DAX time-intelligence frameworks, advanced relational SQL, and AI-augmented analytics workflows (FastMCP + Claude). Focused on solving revenue leakage, credit risk, operational transit bottlenecks, and retention dynamics.

10
Flagship BI Repos
550K+
Records Modeled
100%
Open Source on Git
Gurugram
Delhi-NCR, India

Technical Competencies

Core Analytics & BI Stack

Business Intelligence

Power BI Desktop, DAX Studio, Tabular Modeling, Power Query (M), Advanced Excel Power Pivot (xVelocity Engine), Executive UI Layouts.

Databases & SQL

PostgreSQL, MySQL, Complex Joins, CTEs, Window Functions (DENSE_RANK, LAG/LEAD), Star & Snowflake Schema Architecture.

Python Data Analytics

Pandas, NumPy, Seaborn, Matplotlib, Exploratory Data Analysis (EDA), Cohort Analysis, Correlation Matrices, Jupyter Notebook.

AI & FastMCP Workflows

FastMCP Claude Analytics Servers, Automated Forensic Analysis, LLM Prompt Engineering, Git Version Control, GitHub Open-Source.

Proof of Capability

10 Production Analytics Projects

Each project features full data pipelines, clean dimensional schemas, live dashboards, and verifiable commercial impact.

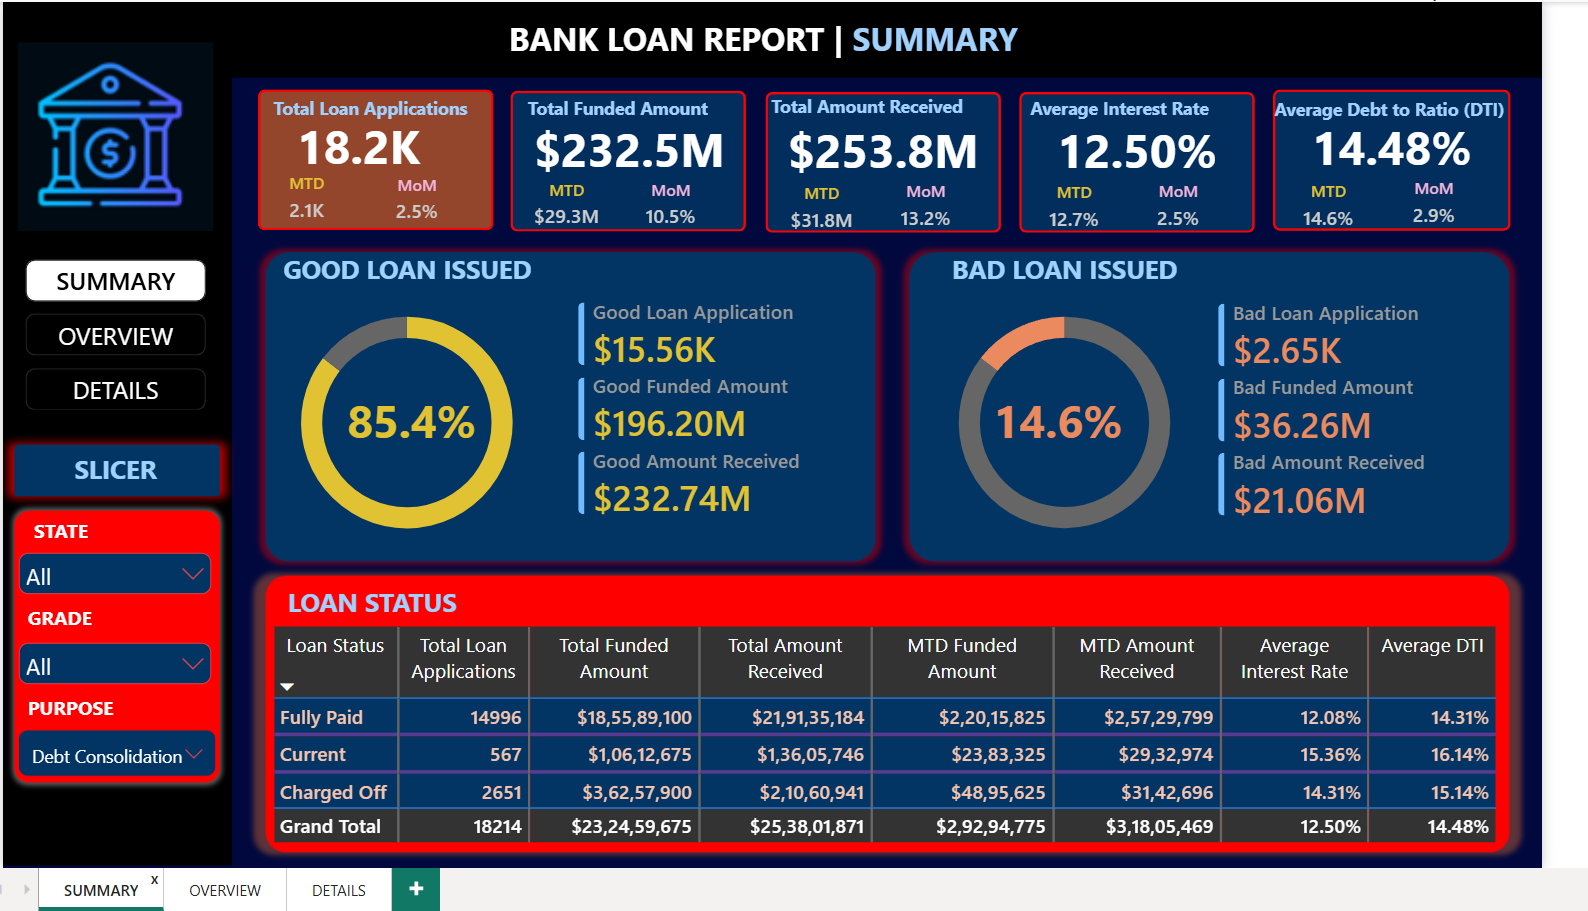
Bank Loan Dashboard
Click to View Pipeline Architecture
Power BI MySQL Python DAX

Bank Loan Portfolio Risk & Liquidity Analytics

Cleaned raw loan data via Python, engineered 37 validated SQL queries for DTI & default ratios, and built a 3-page Power BI dashboard isolating capital adequacy.

KPIs: 38.6K Loans · $435.8M Disbursed · 86.2% Good Loan Surplus · 56.9% Recovery Rate
Repository
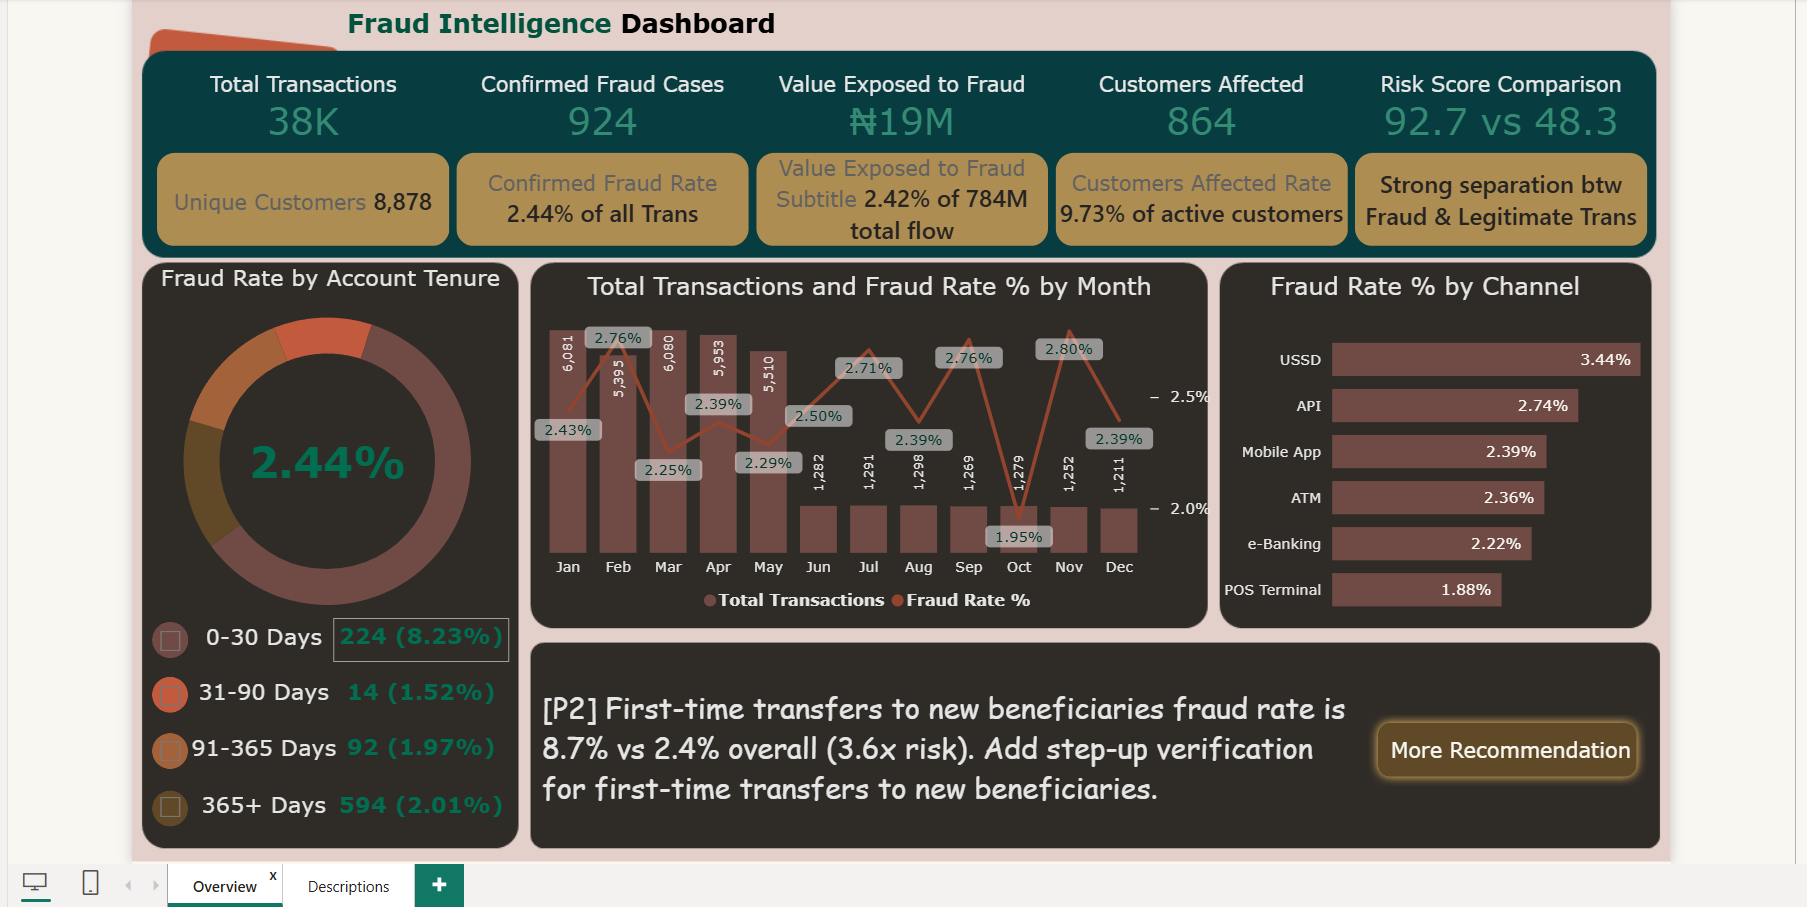
Fraud Intelligence Dashboard
Click to View Pipeline Architecture
Power BI FastMCP Claude AI DAX

Financial Fraud Behavioral Risk & Anomaly Intelligence

Modeled 37.9K transactional logs into an enterprise forensic model with a custom FastMCP server generating real-time AI anomaly narratives.

KPIs: 37.9K Logs · 924 Fraud Cases · ₦19M Compromised · 10.2x Foreign IP Risk Uplift
Repository
Personal Finance Dashboard
Click to View Pipeline Architecture
Power BI DAX Time-Intel Star Schema

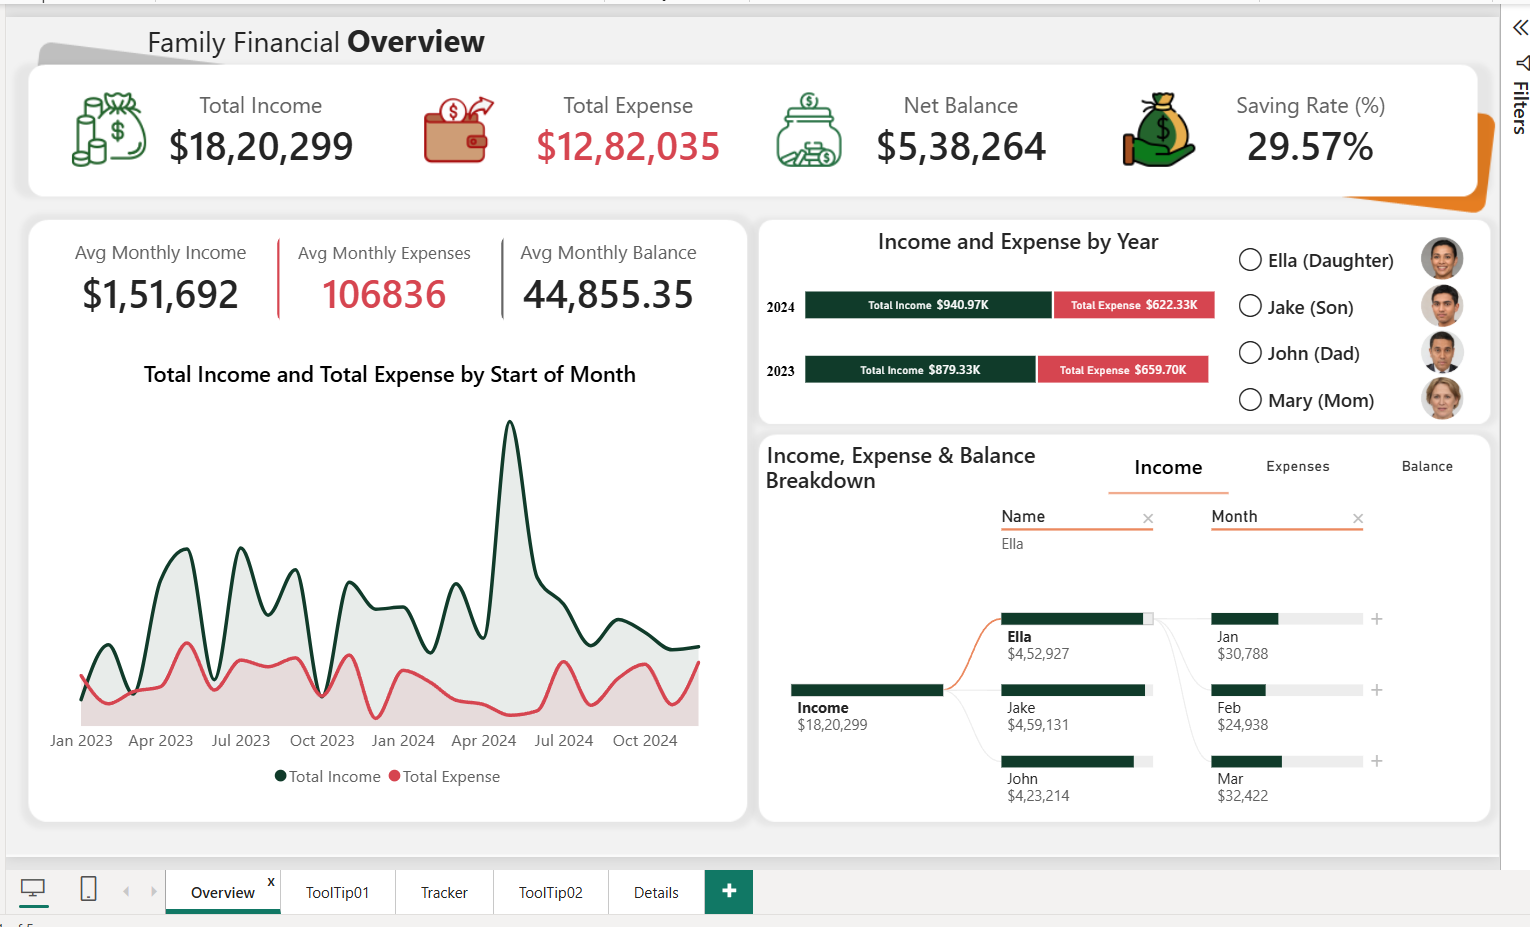
Personal Finance & Wealth Cash-Flow Intelligence

Engineered an interactive household cash-flow suite with dynamic SVG linear gauge indicators and automated 30% savings threshold tracking.

KPIs: 2,216 Entries · $1.82M Flow · $538K Surplus · 29.57% Savings Velocity
Repository
AdventureWorks Dashboard
Click to View Pipeline Architecture
Excel Power Pivot xVelocity Engine DAX

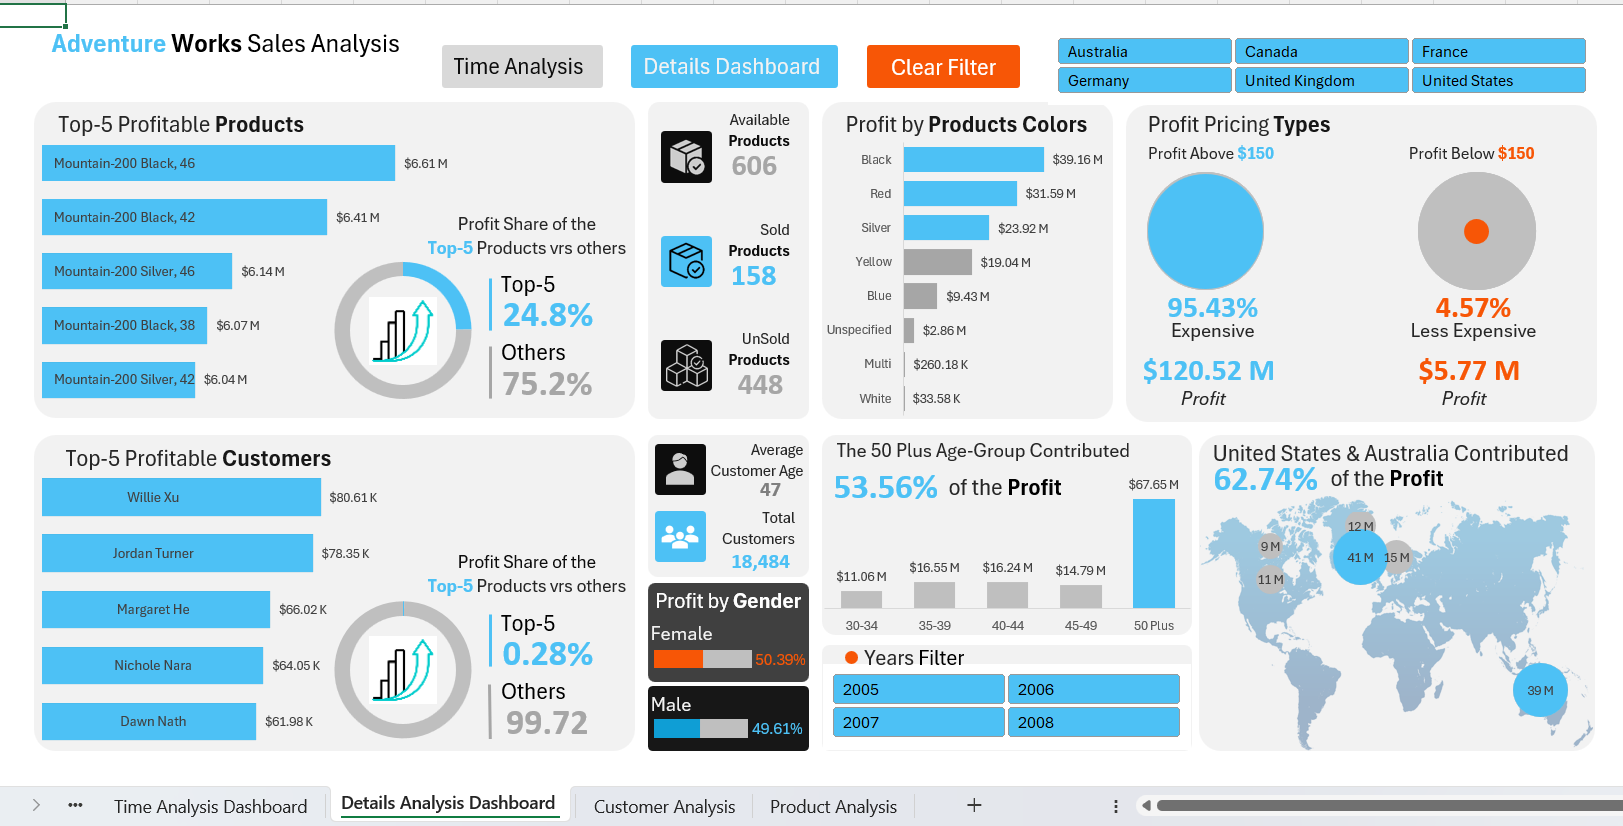
Global Retail Sales & Profit (AdventureWorks DW)

Modeled 60,400 orders in-memory inside Excel with zero external BI dependencies, designing 25+ DAX calculated measures and territory drilldowns.

KPIs: 60.4K Orders · $307.1M Revenue · $126.3M Profit · 41.1% Operating Margin
Repository
Transit Fleet Dashboard
Click to View Pipeline Architecture
Excel Claude AI MCP Power Pivot

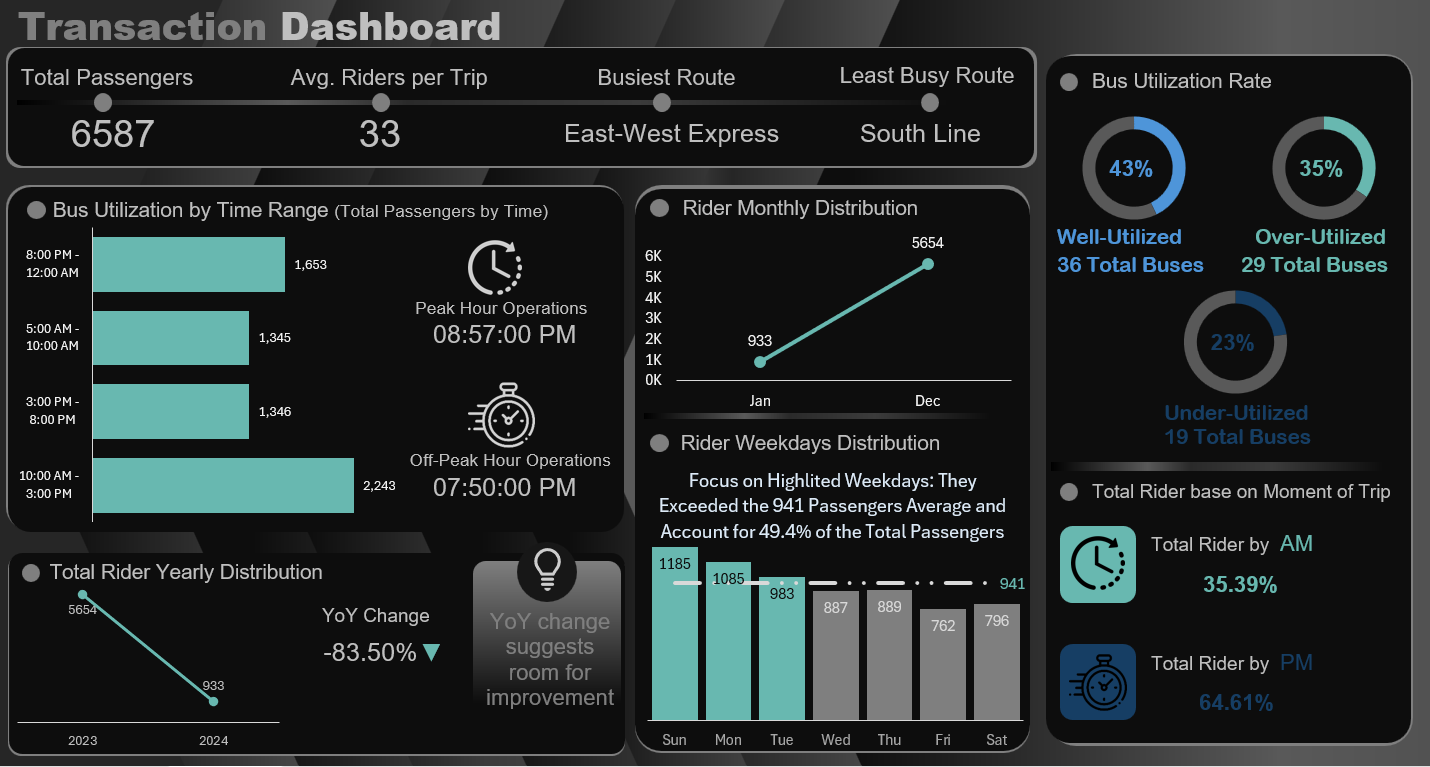
Public Transit & Fleet Operations Dashboard

Orchestrated a relational transit model tracking 6,585 passenger trips with AI-assisted capacity diagnostic analysis for peak congestion corridors.

KPIs: 6,585 Passenger Trips · 4 Transit Corridors · >92% Peak Capacity · 3 Bottlenecks
Repository
Coffee Shop Dashboard
Click to View Pipeline Architecture
PostgreSQL Power BI SQL CTEs

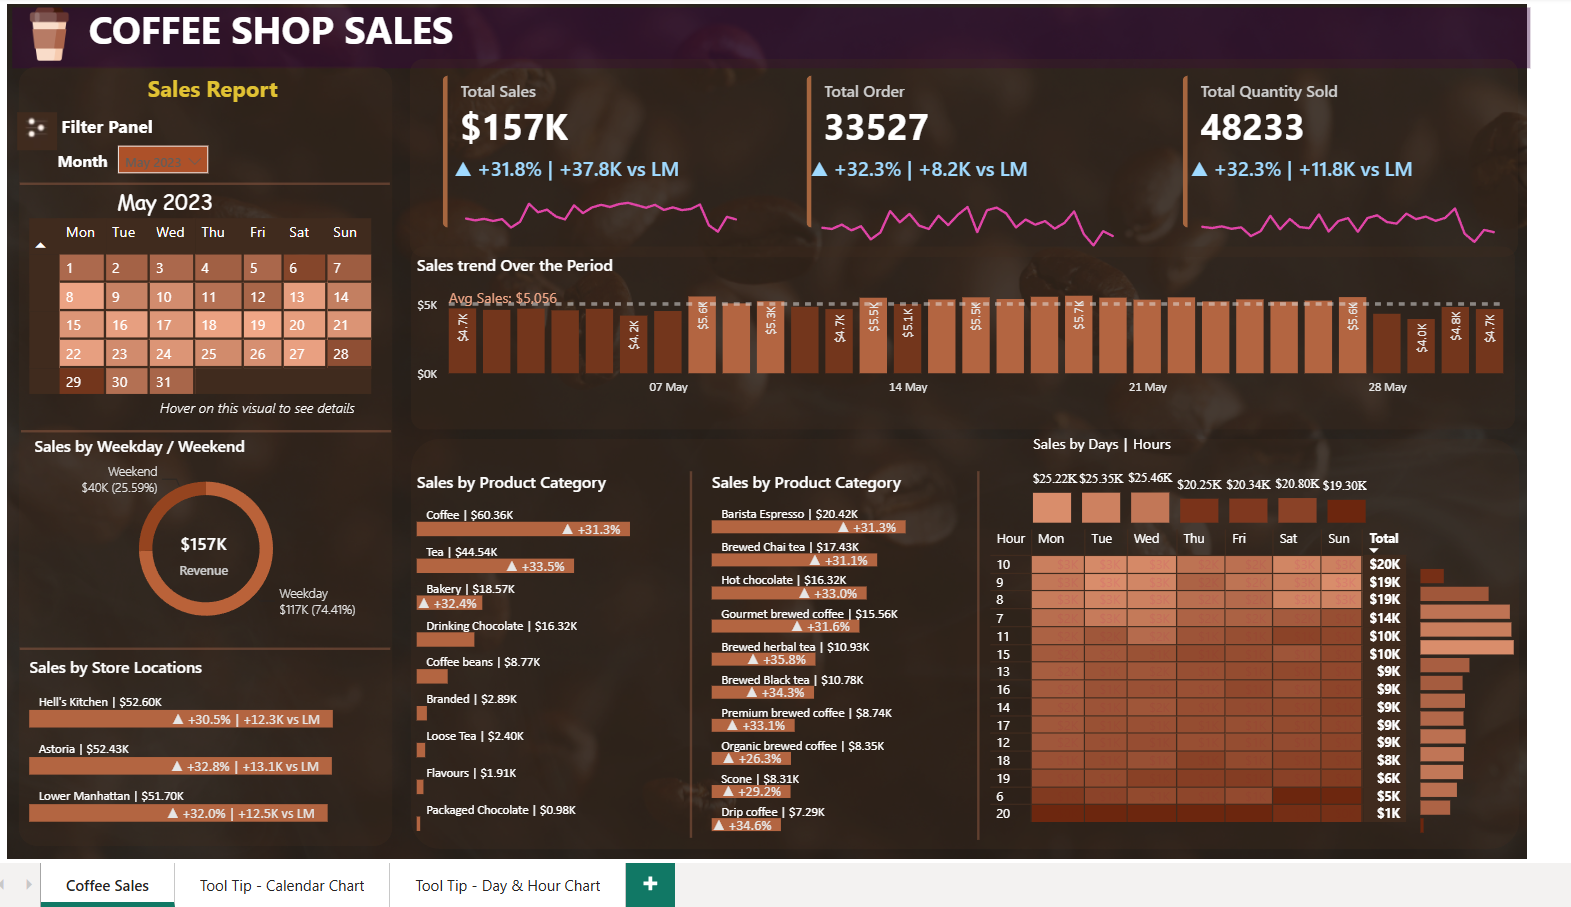
Coffee Shop Sales & Market Expansion Intelligence

Synthesized 149K POS transactions and benchmarked 14 Indian metro markets using a 10-query SQL framework (DENSE_RANK, LAG) to rank expansion targets.

KPIs: 149.1K POS Trans · 14 Metros · Top 3: Pune, Delhi, Jaipur · 42% Rush Share
Repository
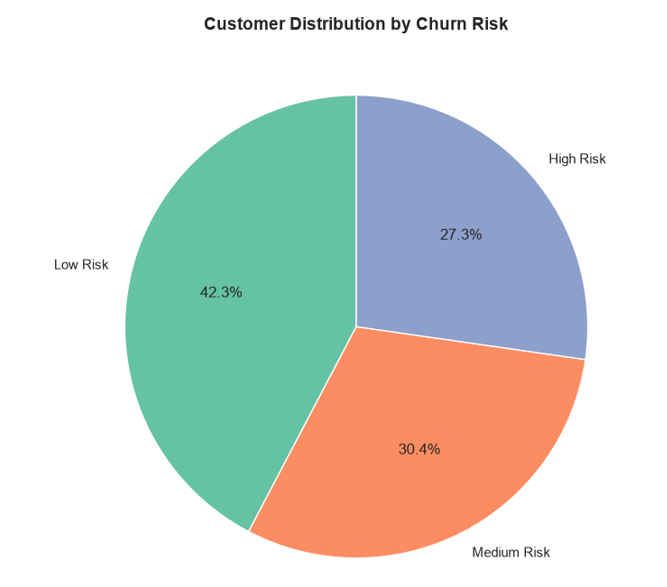
Customer Churn Risk Distribution
Click to View Pipeline Architecture
Python Pandas Seaborn Statistical EDA

Customer Churn Behavioral Analytics & Retention Engine

Evaluated 10,000 subscribers and modeled tenure cohorts, uncovering months 1-12 as the vulnerability window with 48%+ contract churn.

KPIs: 10K Subscribers · 27.27% Churn · 72.73% Retention · $73.3K Monthly MRR at Risk
Repository
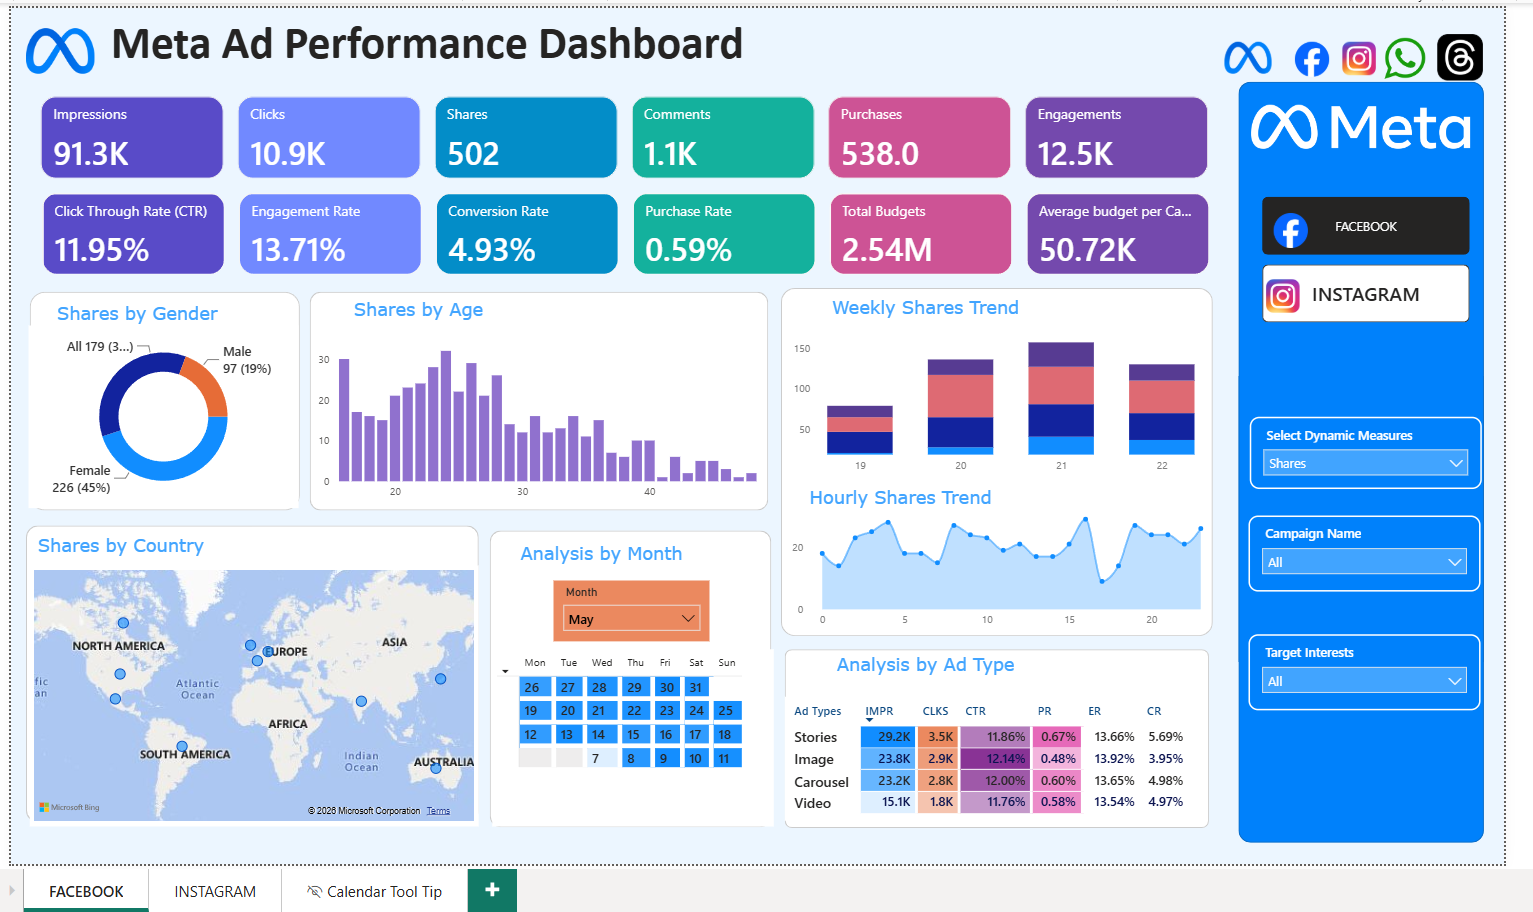
Meta Ad Dashboard
Click to View Pipeline Architecture
Power BI PostgreSQL Snowflake Schema

Meta Ad Campaign Performance & Marketing Intelligence

Modeled 400K ad logs across Facebook & Instagram for a $2.54M spend, proving Stories format outperforms Feed placements with a 5.69% CVR.

KPIs: 400K Events · $2.54M Spend · 11.79% CTR · 5.69% Stories CVR (vs 3.42% Feeds)
Repository
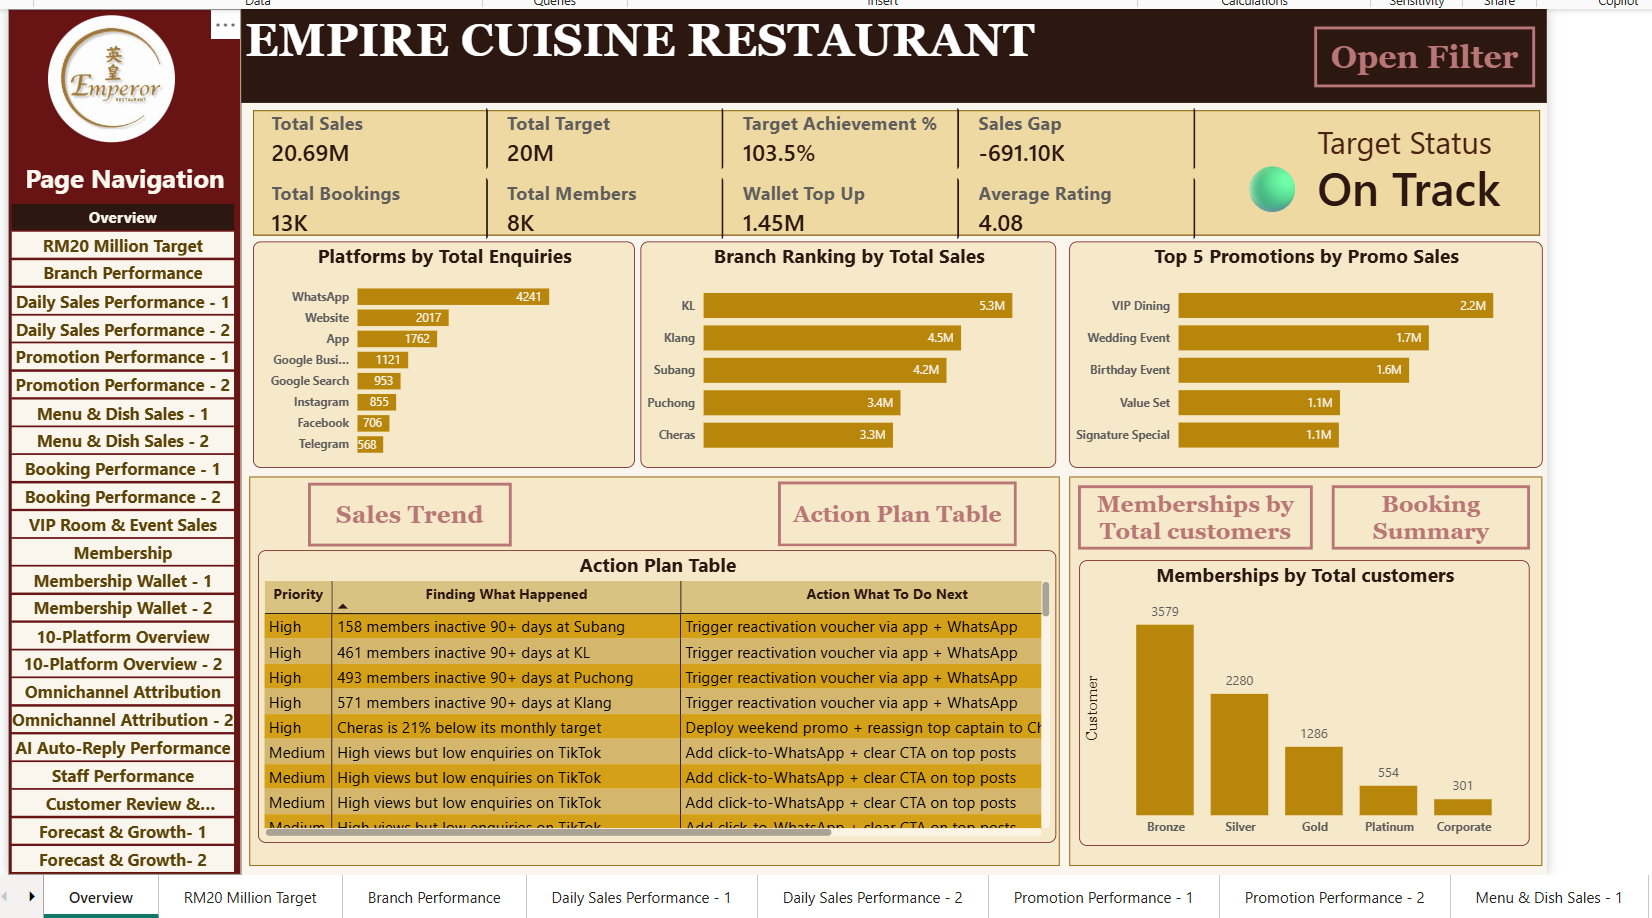
Emperor Restaurant Dashboard
Click to View Pipeline Architecture
Power BI (24 Pages) Star Schema (11 Dims) DAX

Emperor Cuisine Restaurant Enterprise BI Platform

24-page analytical BI platform supported by 11 dimensions and 12 fact tables, formulating an actionable RM799K management value pipeline.

KPIs: RM20.69M Sales · 5 Branches · 103.5% Target Achieved · RM799K Action Plan
Repository
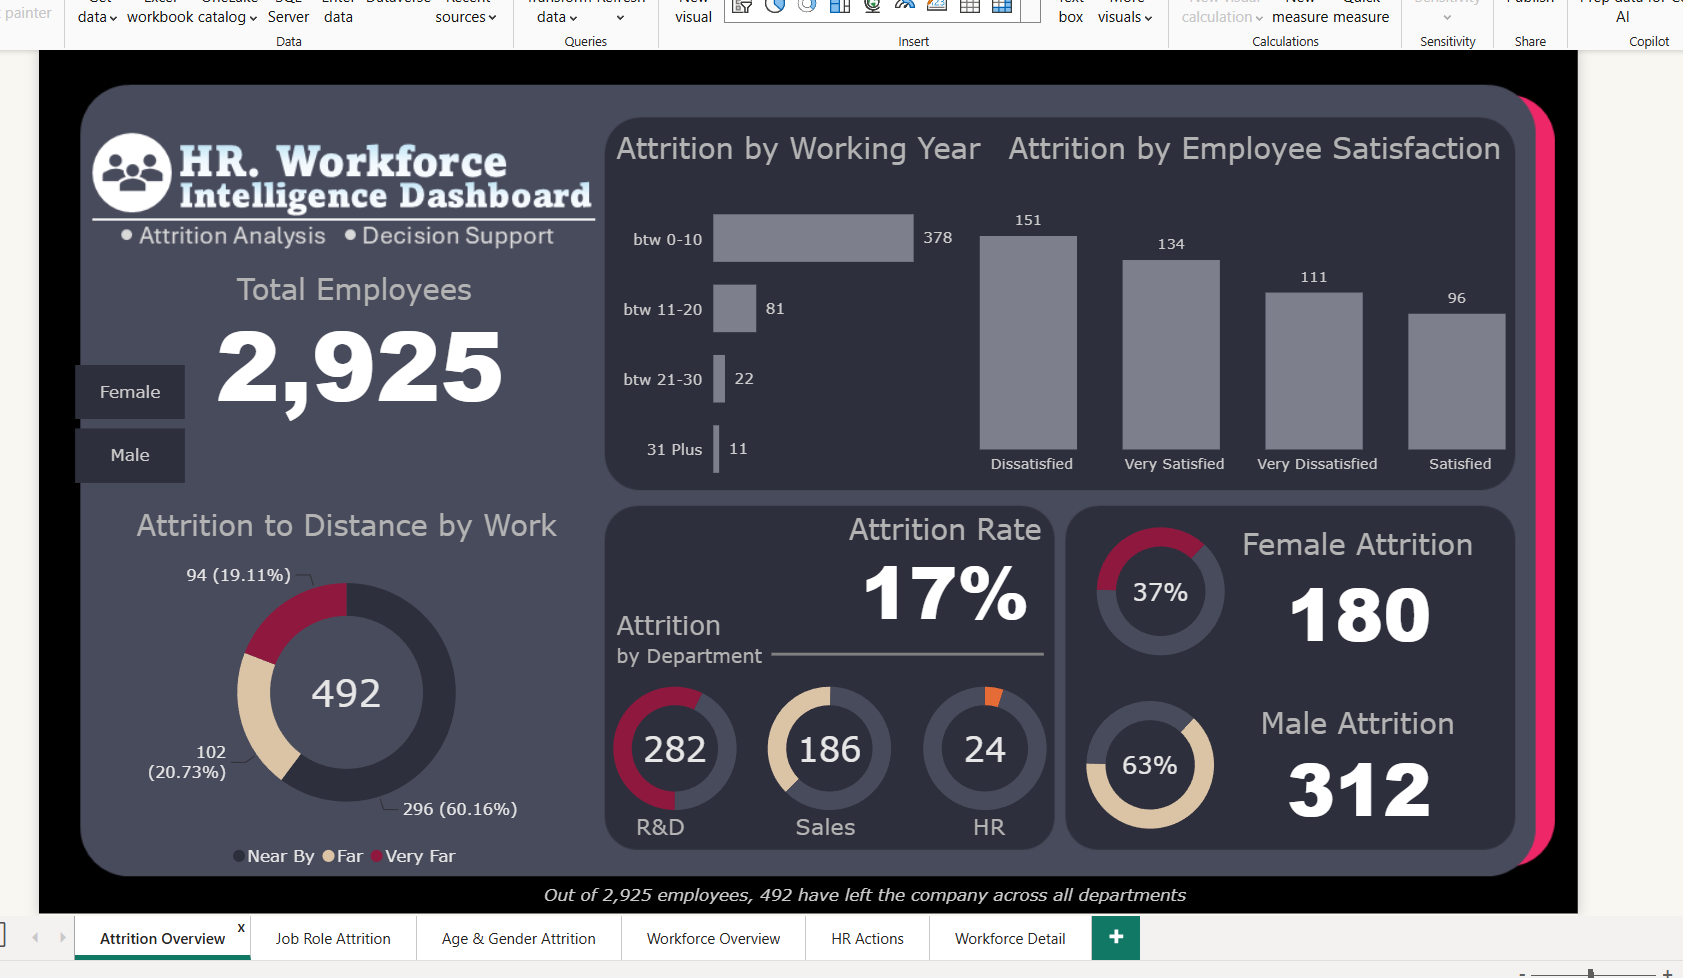
HR Workforce Dashboard
Click to View Pipeline Architecture
Power BI (6 Pages) DAX Rule Engine Power Query

HR Workforce Intelligence & Decision Support Dashboard

Diagnosed attrition patterns across 2,925 employee records, utilizing automated DAX rule engines to isolate 144 promotion-ready and 234 retrenchment-review staff.

KPIs: 2,925 Headcount · 16.82% Attrition · 144 Promotion Ready · 234 Retrenchment Review
Repository